Blog Archives
Three Caps Numbers: Talkin’ ’bout Time on Ice
Photo by Amanda Bowen of RRBG Photography
13:49
Marcus Johansson’s ice time vs Tampa last night, the second straight game he’s been below the 14:00 mark and fifth time in the past six games his ice time has decreased. The third line has been great since the return of Brooks Laich, and Jason Chimera is rejuvenated and helping the fourth line. But Johansson has taken big strides forward this season and it would be a shame to see that stunted by limiting his ice time.
17:38
The average time on ice per game for Joel Ward, 4th among all Caps forwards behind Nick Backstrom, Alex Ovechkin, and Troy Brouwer. I like Joel Ward and think he’s an effective hockey player. But he’s a bottom-6 forward. Why is Joel Ward the 4th most used forward by Barry Trotz? He’s also 4th in terms of 5v5 ice time, so it’s not as if his penalty kill time is inflating his numbers.
16:12
The average 5v5 ice time per game for Backstrom this season, which leads all NHL forwards. His linemate Ovechkin is second. Trotz looks like he’s going to ride his two horses as much as he can. It’s easy to like this strategy.
Caps advanced stats All-Stars of the Ovechkin Era
As part of their 40th anniversary season, the Caps are asking fans to help them vote on the 40 greatest Caps players in the team’s history. I’m not asking for your vote and I’m not looking at the entire history of the team. Instead, I am looking at the Caps advanced stats All-Stars from the Alex Ovechkin era (2005-06-present). I am not claiming that advanced stats are the end of the discussion when it comes to player evaluation. However, they are for my purposes here. I also didn’t consider forward specific positions. Instead, I picked 3 forwards and 2 defenseman. I set the minimum games played to a completely arbitrary 115 games.
To rank the players, I looked at FenClose, FenClose rel, zone starts, and quality of competition. If a player ranked 1st, he got 5 points, down through 5th place getting 1 point. This was done for each of the 4 categories.
Without further delay, here are the long-awaited Caps advanced stats All-Stars from the Ovechkin era.
Forward #1-Sergei Fedorov (10 points)
Fedorov finished first in FenClose (56.19%) and FenRel (+4.43%). He wasn’t anywhere near the top in zone starts (0.73%% ZS rel), but did finish 8th in quality of competition (28.82).
Forward #2-Nick Backstrom (9 points)
Backstrom’s FenClose was good enough for 5th (53.44) and his FenRel 3rd (+3.28%). Backstrom’s zone starts were not noteworthy (6.08%). Backstrom really shines in quality of competition, where he finished first (29.63%)
Forward #3-Viktor Kozlov (7 points)
Kozlov finished 2nd in FenClose (54.48%), but did not place in the top-5 in FenClose rel (0.34%), a sign that he benefited from playing on very strong possession teams. Kozlov also didn’t find himself in the top-5 in zone starts (5.58% ZS rel). However, he finished 3rd in quality of competition (29.39), cementing his place on the All-Star team.
Defenseman #1-Mike Green (10 points)
This isn’t surprising to anyone who pays attention to possession numbers. Green finished 1st in FenClose (53.10%) and 2nd in FenClose rel (+3.12%). Green didn’t place in the top 5 in zone starts (4.54%) but came in 5th in quality of competition (28.62%).
Defenseman #2 Shaone Morrissonn (9 points)
This was the biggest surprise to me, by a long ways. Morrisonn finished 5th in FenClose (50.21%) but didn’t make the top 5 in FenClose rel (-1.21%). He faced the toughest zone starts (-4.17%) and the 3rd toughest quality of competition (29.03%).
Here’s a player usage chart of the 5 All-Stars.
Morrisonn was the only negative possession player relative to his teammates. However, this is counter-balanced by the fact that he faced the toughest zone starts and 3rd toughest competition among all qualified defenseman. His inclusion is still shocking to me.
Ladies and gentlemen, the wait is finally over. Let’s hear it for your Caps advanced stats All-Stars of the Ovechkin era.
War on Ice is awesome: Advanced stats highlights from the Caps 2009-10 season
As we’ve already highlighted here on the blog, advanced stats have gotten a lot of publicity this summer. A large part of this was due to NHL front offices making hires that were aimed at forming analytic departments. One of those hires, by the Toronto Maple Leafs, was Darryl Metcalf, the founder of ExtraSkater.com. Extra Skater was the go-to advanced stats resource for many people, myself included, but was shut down when Metcalf was hired by the Leafs. One site that has popped up in Extra Skater’s place is War on Ice. I’ve tweeted some of the stuff that makes War on Ice such a cool site, even eclipsing Extra Skater in terms of depth and quality. While Extra Skater had stats from the present day dating back to the 2010-11 season, War on Ice has stats starting with the 2002-03 season. Much like I did when Extra Skater added stats from the ’10-11 season, I wanted to highlight some interesting stats on War on Ice from seasons that were not available on Extra Skater. This post will take a look at advanced stats highlights from the Caps 2009-10 season. This post will far from exhaust all there is to say about the information available on War on Ice from the 2009-10 Caps. Instead, this post is both an effort to point out some interesting highlights, as well as show off some of the stuff that makes War on Ice so great.
For those who don’t remember, 2009-10 was the season that the Caps dominated the league and were then Halak’d out of the playoffs by the Montreal Canadians in the first round of the playoffs. The Caps were dynamic. 6 players had over 20 goals. Mike Green had 76 points in 75 games. As a lifelong sports fan, this team was the most exciting team I’ve rooted for, regardless of the sport.
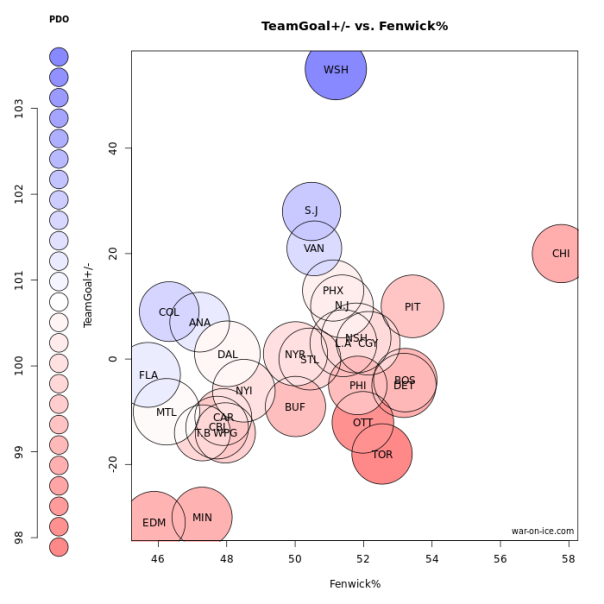
To start, here’s a look at 2009-10 via just one of the seemingly endlessly customized chart options on War on Ice. This is a chart looking at all 30 NHL teams. The X-Axis is Fenwick %. The Y-Axis is team goal +/- and the color bubble variance is PDO. The bubble size variance is time on ice, fairly trivial for this chart. This is at 5-on-5 in close game situations.
The further right, the better the team was, as measured by puck possession. A blue bubble would indicate good fortunate, with red representing poor fortunate.
-The Caps were good, according to Fenwick, but not elite. They finished 12th in FenClose as a team. The Caps FenClose % of 51.19 is their 3rd best since 2002.
-The Caps have the darkest blue circle, meaning they led the league in PDO at an absurd 103.60.
-My quick takeaway from this chart is that the Caps, at 5-on-5, were a good team that was also very fortunate, which resulted in the huge goal differential.
-War on Ice tracks PDO back to 2002, and the 103.60 is by far the highest season PDO the Caps have had in the time frame. The next highest is 101.78 (2002-03)
The next chart is a look at the Caps defenders. The X-axis is FenRel % and the Y-axis is TOI Competition %. The bubble size and color are set to TOI/G. I’m not sure what variable to use as the 4th that will contribute to the substance of this chart, so I TOI is left as a repeat. I’m open to suggestions!
A few takeaways from this chart:
-Tom Poti and Joe Corvo played a lot of minutes. They were tough minutes and they handled them really well.
-Karl Alzner played against weak competition and he struggled.
-Why was Brian Pothier getting more minutes than Shaone Morrisonn and Milan Jurcina?
Here are some other interesting details. First, the Caps top 5 FenClose Rel from 2009-10
| Player | Games | FenClose Rel |
| Ovechkin | 71 | 5.59 |
| Backstrom | 81 | 4.64 |
| Poti | 69 | 4.31 |
| Gordon | 35 | 3.83 |
| Steckel | 78 | 3.45 |
And the 5 worst
| Player | Games | FenClose Rel |
| Alzner | 21 | -7.04% |
| Chimera | 77 | -4.89% |
| Perreault | 21 | -4.86% |
| Sloan | 39 | -4.78% |
| Fleischmann | 68 | -4.02% |
These charts are pretty self-explanatory. Ovechkin and Backstrom, those two guys are pretty good, eh?
Let us not forget that 2009-10 was the year that Jeff Schultz led the league in +/-. Now, when arguing with someone about how flawed of a stat +/- is, you can give them Schultz’s exact PDO in the ’09-10 season. Schultz’s PDO was 105.75, which was somehow only good enough for 4th on the Caps that season, behind Carlson (105.89), Fehr (105.87), and Ovechkin (105.81). If only considering players who played in 41+ games, Henrik Sedin finished first in the NHL in PDO at 106.71. The next 3 players league-wide were Caps! Carlson only appeared in 22 games, so the top 4 in the NHL is rounded out by Fehr, Ovechkin, and Schultz.
This look at the 2009-10 season is just scratching the surface of the data available on War on Ice. Go ahead and head over there yourself but be prepared to get lost for days!
Mikhail Grabovski: Caps loss is Isles gain (Jeremy Roenick is still wrong)
Yup, this is my second post about ex-Caps player Mikhail Grabovski in the past week. While it’s not my intention in writing this, this is further proof of how wrong Jeremy Roenick is about Grabovski. But this post is more about the fact that the loss of Grabovski hurts the Caps, while the Isles will benefit from signing him.
On a personal level, Grabovski was the Caps player I most enjoyed watching last season. From a team level, he was a possession monster and a nice solution to the Caps problems at 2C that could have been had long-term for a reasonable salary. But I shouldn’t be the only one missing Grabovski. In fact, most everyone of his teammates should be missing him because almost every Caps player saw an improvement in their possession numbers in the minutes they played with Grabovski vs. when they played without him.
Here is a look at how every Caps forward fared while playing with Grabovski vs. while playing without him. I cut off the minimum minutes at 19:48, so as not to exclude possession anchor Aaron Volpatti. Sample-size warnings obviously apply, but you can see a trend. SA% is the % of shot attempts the Caps saw go in their favor while that player was on the ice.
| Player | TOI w/Grabovski | SA% w/Grabovski | TOI w/out Grabovski | SA% w/out Grabovski | Grabovski effect |
| Brouwer | 273:16 | 51.6 | 756:55 | 46.4 | +5.2 |
| Fehr | 271:10 | 55.1 | 641:53 | 46.4 | +8.7 |
| Ovechkin | 235:19 | 50.8 | 888:27 | 48.8 | +2.0 |
| Chimera | 223:53 | 49.8 | 804:11 | 45.6 | +4.2 |
| Ward | 207:13 | 51.2 | 787:24 | 46.2 | +5.0 |
| Laich | 123:59 | 48.1 | 508:47 | 47.9 | +0.2 |
| Backstrom | 82:42 | 47.3 | 1070:13 | 49.5 | -2.2 |
| Wilson | 40:53 | 48.8 | 598:32 | 44.8 | +4.0 |
| Erat | 38:20 | 58.5 | 799:17 | 49.7 | +8.8 |
| Johansson | 27:26 | 54.8 | 1039:55 | 48.2 | +6.6 |
| Beagle | 19:49 | 46.2 | 609:13 | 44.6 | +1.6 |
| Volpatti | 19:48 | 38.1 | 279:42 | 39.7 | -1.6 |
-10 of the 12 Caps forwards who played 19:48+ with Grabovski this past season saw an increase in SF% with Grabovski vs without him, the only two exceptions being Backstrom and Volpatti.
-Remember when Adam Oates started the season with his obvious 2C (Grabovski) on the 3rd line and obvious 2W (Erat) on the 4th line? One wonders what the two could have done if ever given extended minutes together (something I, and many others, called for all season) given their dominating 58.5% SF in the very small sample.
-One interesting tidbit not shows here is that Backstrom, the player with the worst “Grabovski Effect,” saw his highest Goals For % with Grabovski out of all Caps forwards. Certainly just a sample size thing, but interesting nonetheless.
Here’s how are the Caps top 7 D, in terms of minutes played with Grabovski, fared with and without him last season at 5-on-5. Again, sample size warnings apply, but a clear patterns emerges.
| Player | TOI w/Grabovski | SA% w/Grabovski | TOI w/out Grabovski | SA% w/out Grabovski | Grabovski effect |
| Carlson | 291:57 | 49.1 | 1029:15 | 46.3 | +2.8 |
| Alzner | 287:30 | 49.9 | 1005:32 | 46.4 | +3.5 |
| Green | 275:10 | 55.3 | 1003:39 | 50.4 | +4.9 |
| Orlov | 166:52 | 59.9 | 795:41 | 49.0 | +10.9 |
| Schmidt | 130:48 | 49.0 | 358:10 | 51.3 | -2.3 |
| Oleksy | 119:42 | 50.4 | 316:32 | 44.9 | +5.5 |
| Erskine | 92:14 | 53.3 | 405:21 | 43.9 | +9.4 |
-Other than Nate Schmidt, every defender listed saw an improvement in their possession numbers, many of them pretty drastic improvements, when on the ice with Grabovski.
–It’s especially interesting that the two worst puck possession players on the list, Oleksy and Erskine, both became positive possession players in their minutes with Grabovski, which were admittedly limited.
-I know it’s only 166 minutes, but the Caps were dominant when Grabovski was on the ice with Orlov.
Like I said above, sample-size warnings obviously apply here. It should also be noted that none of these numbers include any caveats such as zone starts or quality of competition. But make no mistake about it, regardless of that, the Capitals were a better team with Grabovski on the ice, and his new Islanders teammates will start reaping the benefits in October.
All stats pulled from http://stats.hockeyanalysis.com/
Follow us on Twitter
Advanced stats highlights from the Caps 2010-11 season
Advanced stats for the 2010-11 season are now available on ExtraSkater.com. I highly recommend visiting Extra Skater to see the stats for yourself, but below, after a quick refresher on the season, are some Caps highlights I pulled from a glance at the new stats on Extra Skater.
With a record of 48-23-11, the Caps were not only Southeast Division champs, but finished first in the Eastern Conference, with 107 points. The Caps discarded the Rangers 4-1 in the first round of the playoffs before being swept by the #5 seed Tampa Bay Lightening in the second round. This was also the season during which the Caps, under Bruce Boudreau, shifted to a more defensive-oriented system. The Caps defeated the Penguins 3-1 in the 2011 Winter Classic and were featured on the HBO series 24/7.
-The Caps finished 15th in Fenclose%, tied with the Kings at 50.4. The two teams have gone in opposite directions since, with the Caps (47.5%) finishing 25th in 2013-14 and the Kings (56.7%) finishing first.
-Nicklas Backstorm led all qualifying (41+ games played) Caps in FenClose rel at +5.0%, followed by Alex Ovechkin at +3.9% and Alex Semin at +3.5%. The top Caps defender was John Carlson at +1.9%.
-Alex Semin’s PDO of 107.7 ranked highest on the team, aided by his teammates’ on-ice shooting % of 10.5%, 1.8% higher than any other Caps player.
-Marcus Johansson had the highest ZS% at 58.1%, while Boyd Gordon faced the toughest zone starts, with a ZS% of 41.8%
-As would be expected, the Caps top forward line of Ovechkin, Backstrom, and Mike Knuble faced tougher competition than any of their teammates. Carlson and Karl Alzner faced the toughest competition of any Caps defenders.
-To the surprise of absolutely no one, Mike Knuble had the shortest average shot distance (24.7 feet).
-Alex Ovechkin was on the ice for 82.4% of the Caps PP minutes during the season (this past season Ovechkin saw the ice during 93.2% of the Caps PP minutes).
This was after a quick look at the stats. If you look through Extra Skater and find any interesting tidbits, leave them in the comments below or give us a shout on Twitter.
The issue in the Caps’ top six forwards
There are many ways to win consistently in the NHL. One of those can be by having the right talent, another by having a great system and sticking to it. It doesn’t necessarily matter whether it’s offense or defense-oriented or a little of both, a team with a solid approach that plays it well game-after-game can sometimes make up for talent issues on a roster. And even teams with the best players need a good plan.
In this lockout-shortened season that came without a proper training camp and preseason, it’s apparent that the Washington Capitals could have used that time to learn their new coach’s system. It’s also clear that Adam Oates and the Caps could use a bit more talent in certain areas, one of them being within the six forwards on their first two lines.
With the Caps coming off a 4-0 win in Winnipeg Thursday night, now might seem like an odd time to talk about one of the areas where the team is lacking. But, if the Caps keep winning and make the playoffs or even just miss it, the issue could rear its head again. And, going into next season, it will likely need to be addressed for the team to become a true threat.
In their top six forwards, the Caps have three very talented skill players in Alex Ovechkin, Nicklas Backstrom and Mike Ribeiro. They also have several wingers who are top six material as a compliment to these players.
For example, Brooks Laich, just back from an injury, is a talented and capable left wing that the team can try pairing up with the Ovechkin-Backstrom duo. 22 year-old Marcus Johansson has struggled to develop further as a player while showing promise at times in his still-young NHL career, but he may be another who can be plugged in alongside Backstrom and Ovechkin as he was on Thursday.
Matt Hendricks has also been tried on the top line, though he may deliver better value skating on a lower one. And it appears that Wojtek Wolski and Jason Chimera are done, at least presently, getting time with the top unit.
On the second line with Ribeiro, Troy Brouwer is a solid choice at right wing. With 11 goals and 21 points in 29 games this season, Brouwer is putting up numbers that justify his $3.6 million cap hit and the move the team made to acquire him two summers ago.
On the left side of the second line, Oates can plug-in any number of players, such as he did with Laich last night while skating Johnasson in that spot on the top line. Eric Fehr is also an option as are some others. However, with their current roster of players, it is here on that left side of Ribeiro that the Caps run into the hole in their top six.
Washington has good players that can be used in this second line role, but they are guys that, when put in a top six spot, should mostly be used to complement a skilled duo. The top line currently has Backstrom and Ovechkin. The second has Ribeiro and needs someone else in the highly skilled department, even with Brouwer putting up some nice numbers this season.
In past years, the Caps had a legitimate goal-scoring threat on the left side of their second line in Alexander Semin, but he rarely had the opportunity to play with a second line-caliber center. The Caps now have that center in Ribeiro, but let Semin go and have yet to properly replace him.
Should Washington play well the next week or so and decide to become buyers at this season’s April 3 trade deadline, a deal for a sniping or highly skilled left wing should be high on their list. And going into October and the 2013-14 season, it’s an issue they should eliminate if they are to become a top team again.
The Caps could get by without this player, if they execute Oates’ system consistently. But even then, to take the team’s play to the next level and make them tougher to shut down, the Caps could use someone to fill this gap in their top six.
Related articles
- The case for trading Mike Ribeiro (brookslaichyear.com)
- A look at next season’s Washington Capitals defense and Jeff Schultz (brookslaichyear.com)
- Soon might be the time for Caps to trade goaltender Michal Neuvirth (brookslaichyear.com)
QUESTION FOR YOU: How many Top 6 forwards do the Caps have?
It’s no secret that the 2012-13 Washington Capitals have holes to fill at wing on their top two lines. After going without a legitimate second line center for several years, the Caps’ June 2012 acquisition of Mike Ribeiro from the Dallas Stars appears to have solved that problem at least through the end of this season, when Ribeiro’s contract is set to expire. But after Ribeiro, Nicklas Backstrom and Alex Ovechkin, the “Top 6” talent on the Caps’ 2012-13 roster drops off substantially.
Here’s the question for you, the readers: How many Top 6 forwards do you feel the Caps have on the team right now? Tell us in the comments below or via Twitter (we’ll paste some of your tweets into this post) how many you think the Caps have and who those players are. Your answer does not have to be a whole number. For example, I might score the team at a 3.5 right now:
@ngreenberg @peterhassett safe to say this team has 3 top 6 forwards? 8, 19 and 9. 17 or 20 possibly, sometimes. So maybe 3.5 to 4 out of 6?
— Mike Holden (@mikeholden) February 18, 2013


